2. K-nn Regression
K-nn method (Regression)
The best possible value for
Given data
First: assume
A natural approach:
Here,
This works in data sets where
Idea: instead of requiring
K-nn (K nearest neighbours) method:
Bias-Variance
Variance
Then, provided
Derivation
Bias
For simplicity:
Then:
where
- Variance decreases as
increases - Approximate squared bias increases as
increases - To get a good MSE we have to balance bias and variance. This is called bias-variance trade-off.
Remark: if we let
Derivation
K nearest neighbours
Validation
Should instead use a test set
Test Error
Population level quantity at a fixed value of predictor
Population level quantity across a range of predictors: if
If we had an additional sample, called test sample,
Not really WLLN since
So we split into testing and validating but we have two issue:
- split is random so our model might depend on the split
- Splitting in half might give the wrong bias variance trade off, normally more data means less variance
Improving Cross-Validation
Average validation error over several random splits and/or use a larger portion of the data for learning and smaller for validation
L-fold Cross-Validation
Let
-
Divide data into
disjoint parts (folds) of roughly equal size. Call folds . -
For
, , compute the k-nn estimator based on data
(data not in fold ).
Call resulting estimator. -
Compute test error on the
'th fold
- The selected
is the value with the smallest resulting error over , or
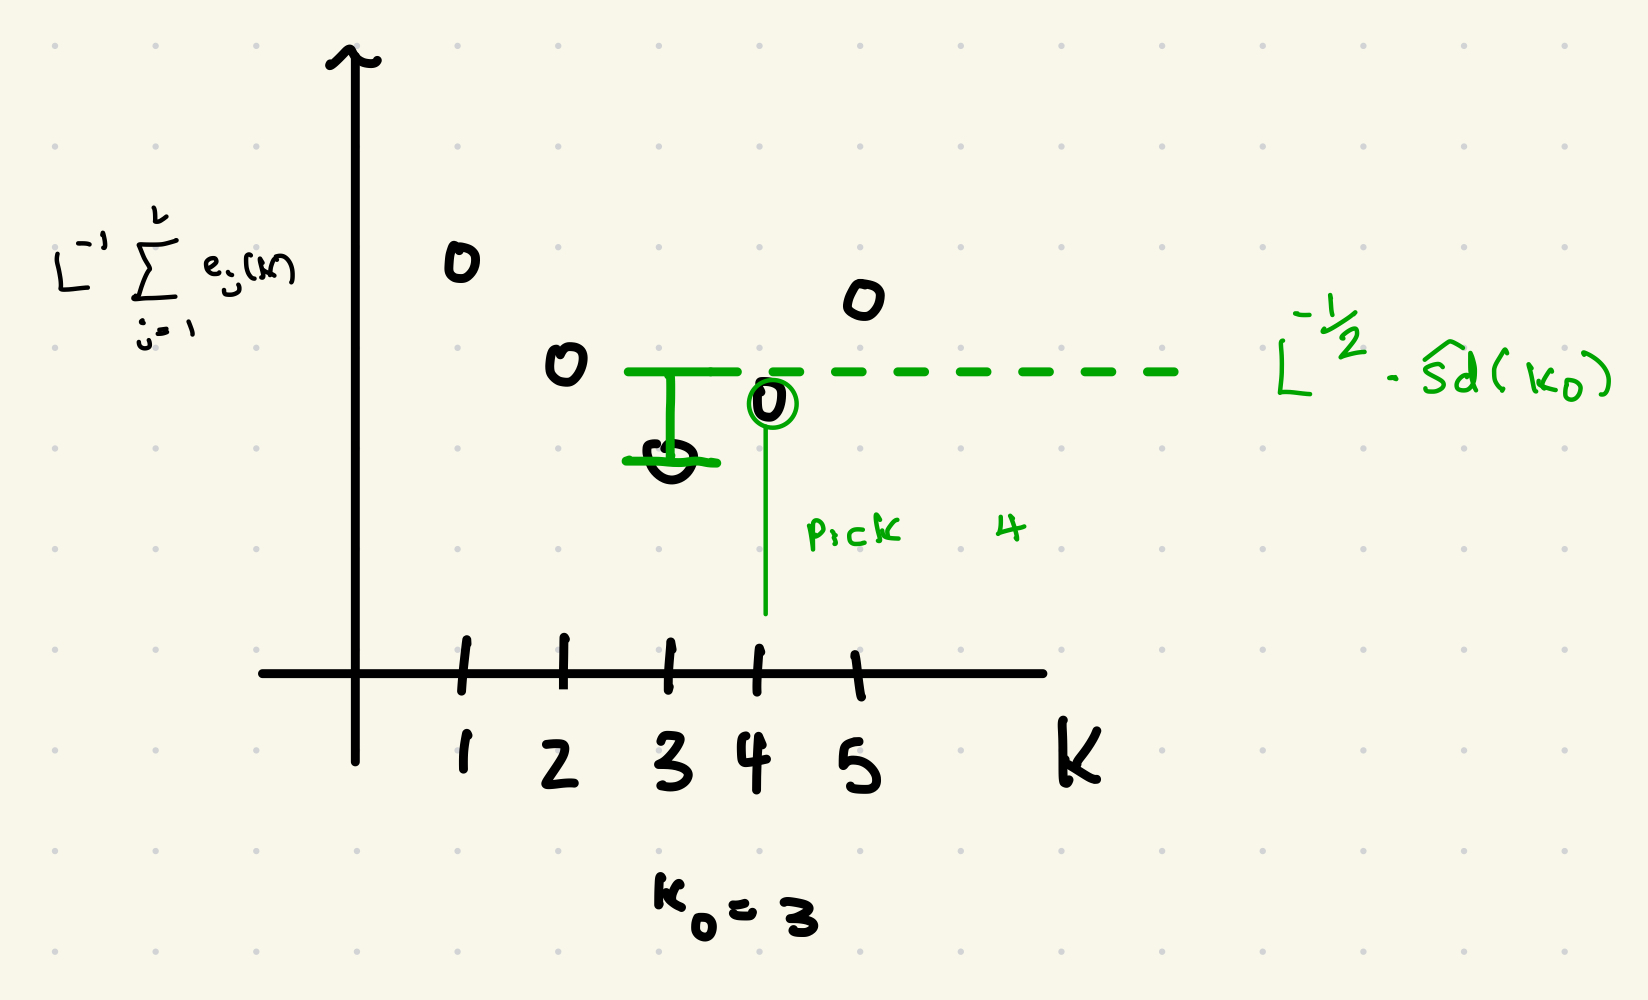
Standard Error Rule
For each value of
Call those errors
Those errors
To reduce noise in model selection, and to select simpler models, one can use the one standard error rule.
-
For each
and each compute as in L-fold cross-validation. -
Find
which minimizes -
Compute
, the sample standard deviation of . -
Select the largest
among those which satisfy
-
Will tend to select simpler models than classical cross-validation (never selects more complicated models), i.e. larger
for k-nn.
Good for building models that are more interpretable. -
Recommended in textbook and other places, but not universally accepted.
No clear theoretical justification.
Model Assessment
- Divide into training and testing
- Use training set to to fit candidates models. This includes tuning parameters with cross-validation
- Use the final models to predict data in the test set and compute test error
Set aside 20%-30% of data for test
Drawbacks of K-nn Regression
Curse of dimensionality: does not work when there are many predictors, especially
of some of those predictors are not important.
Difficult to work with qualitative predictors (student status, color of a car etc).
Resulting model not very interpretable